Project Case Studies
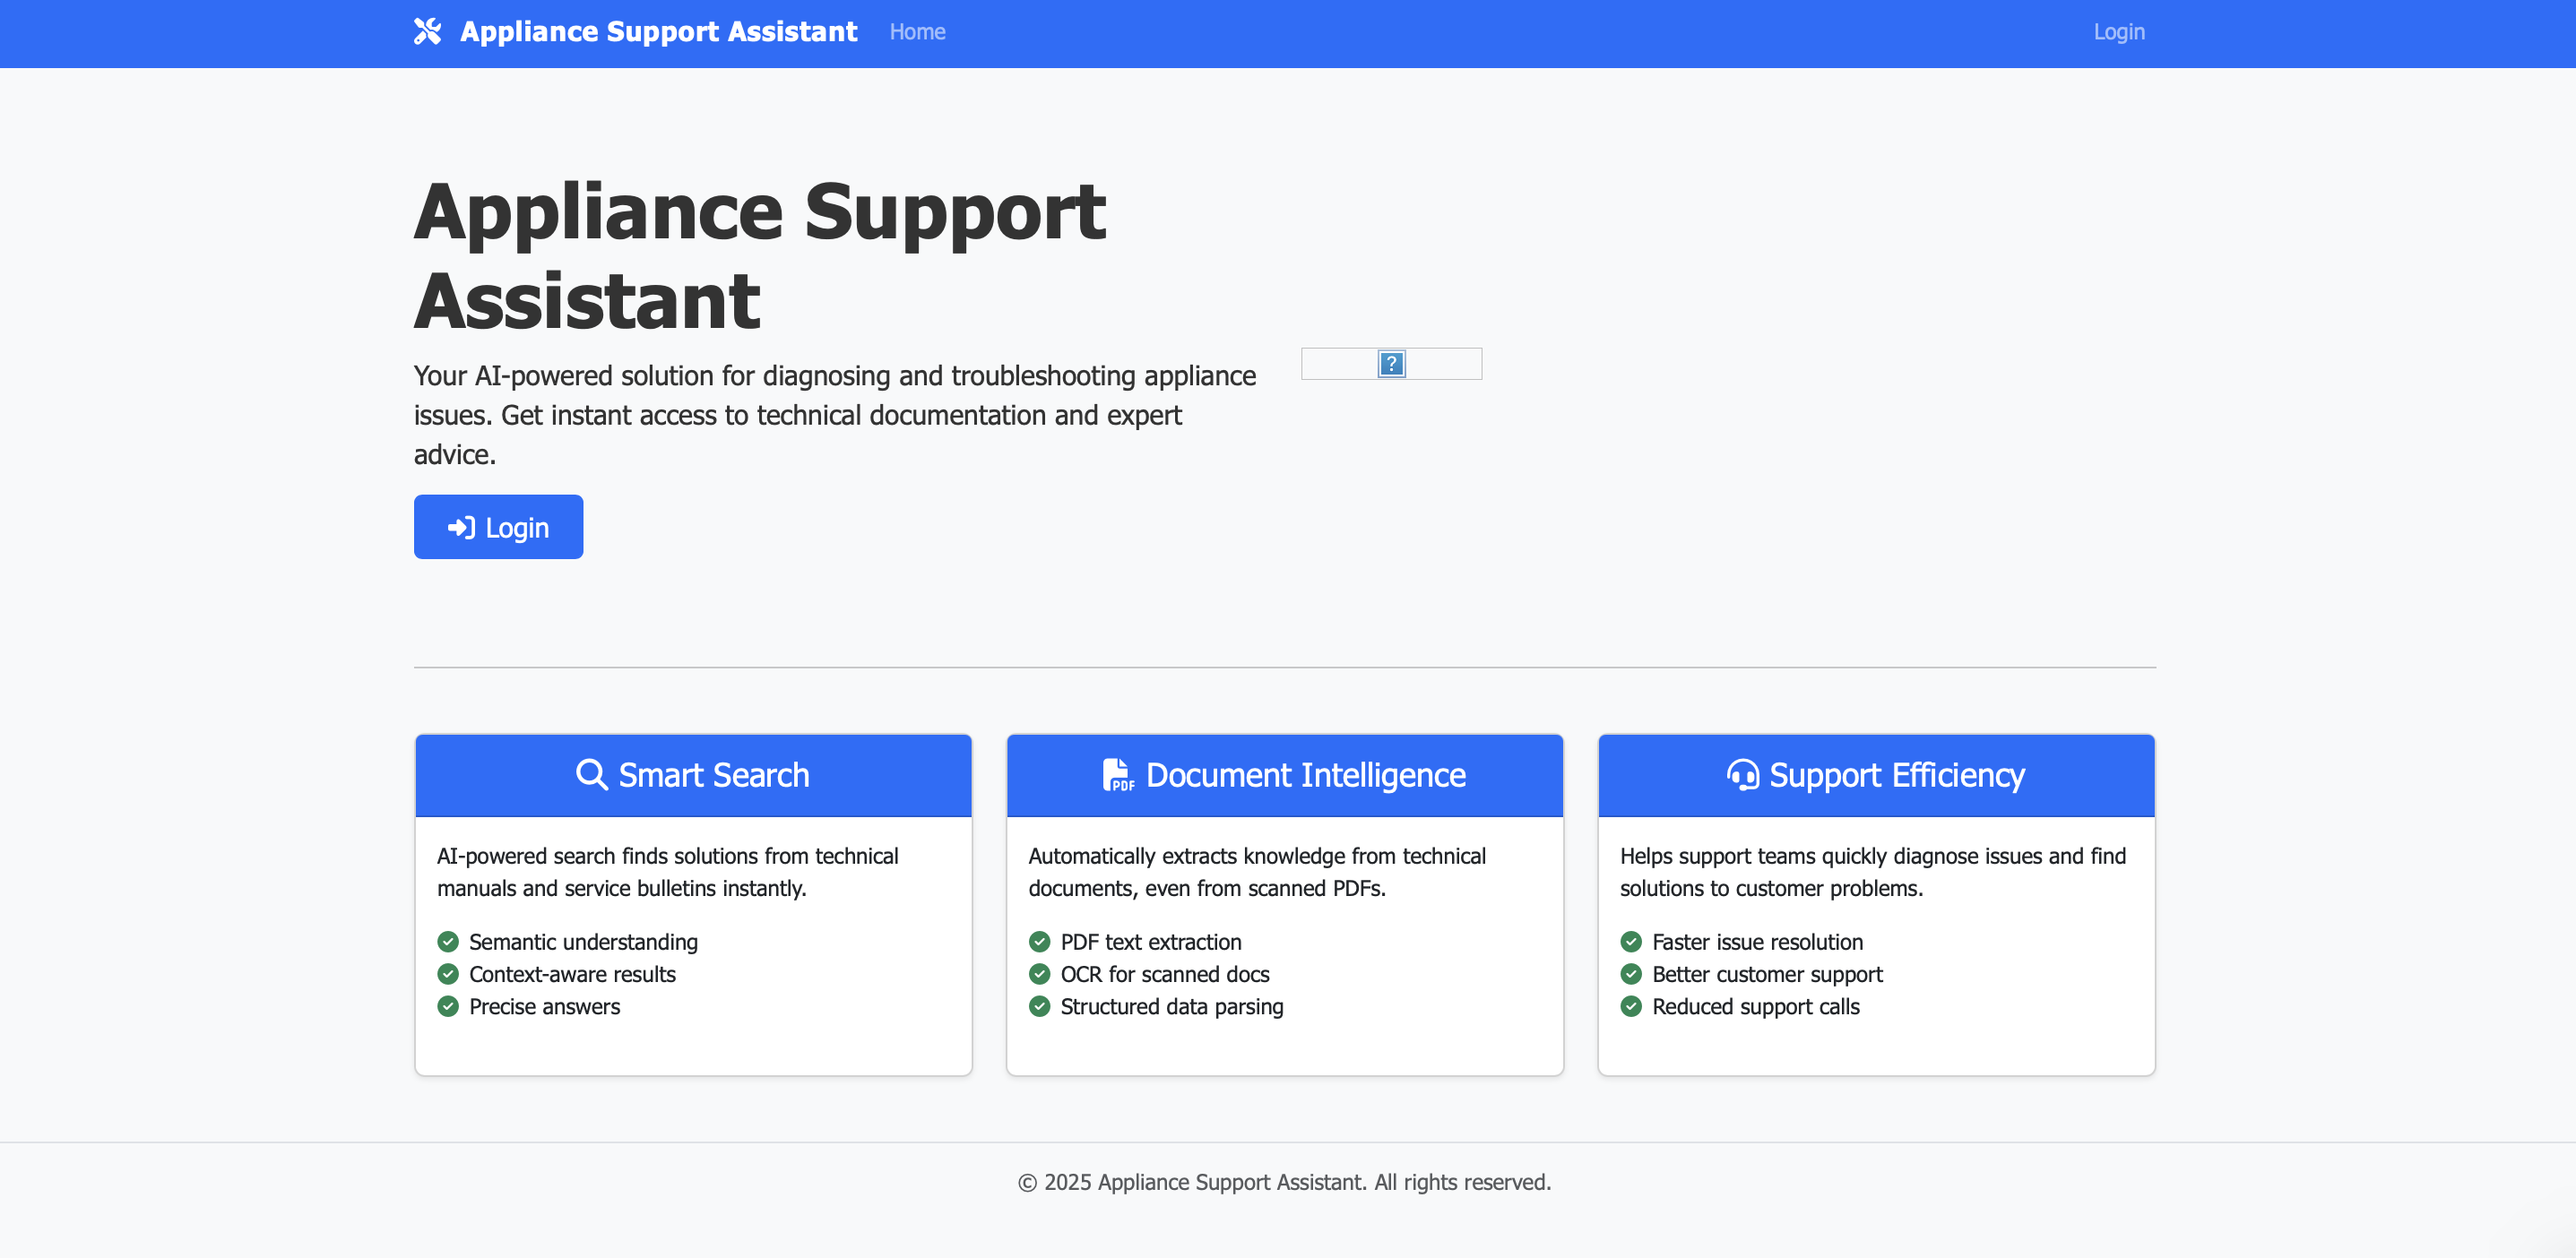
ApplianceSense
Overview: AI-powered chatbot for conversational access to appliance manuals, using lightweight language models, FAISS for semantic search, and Tesseract OCR.
Methodology
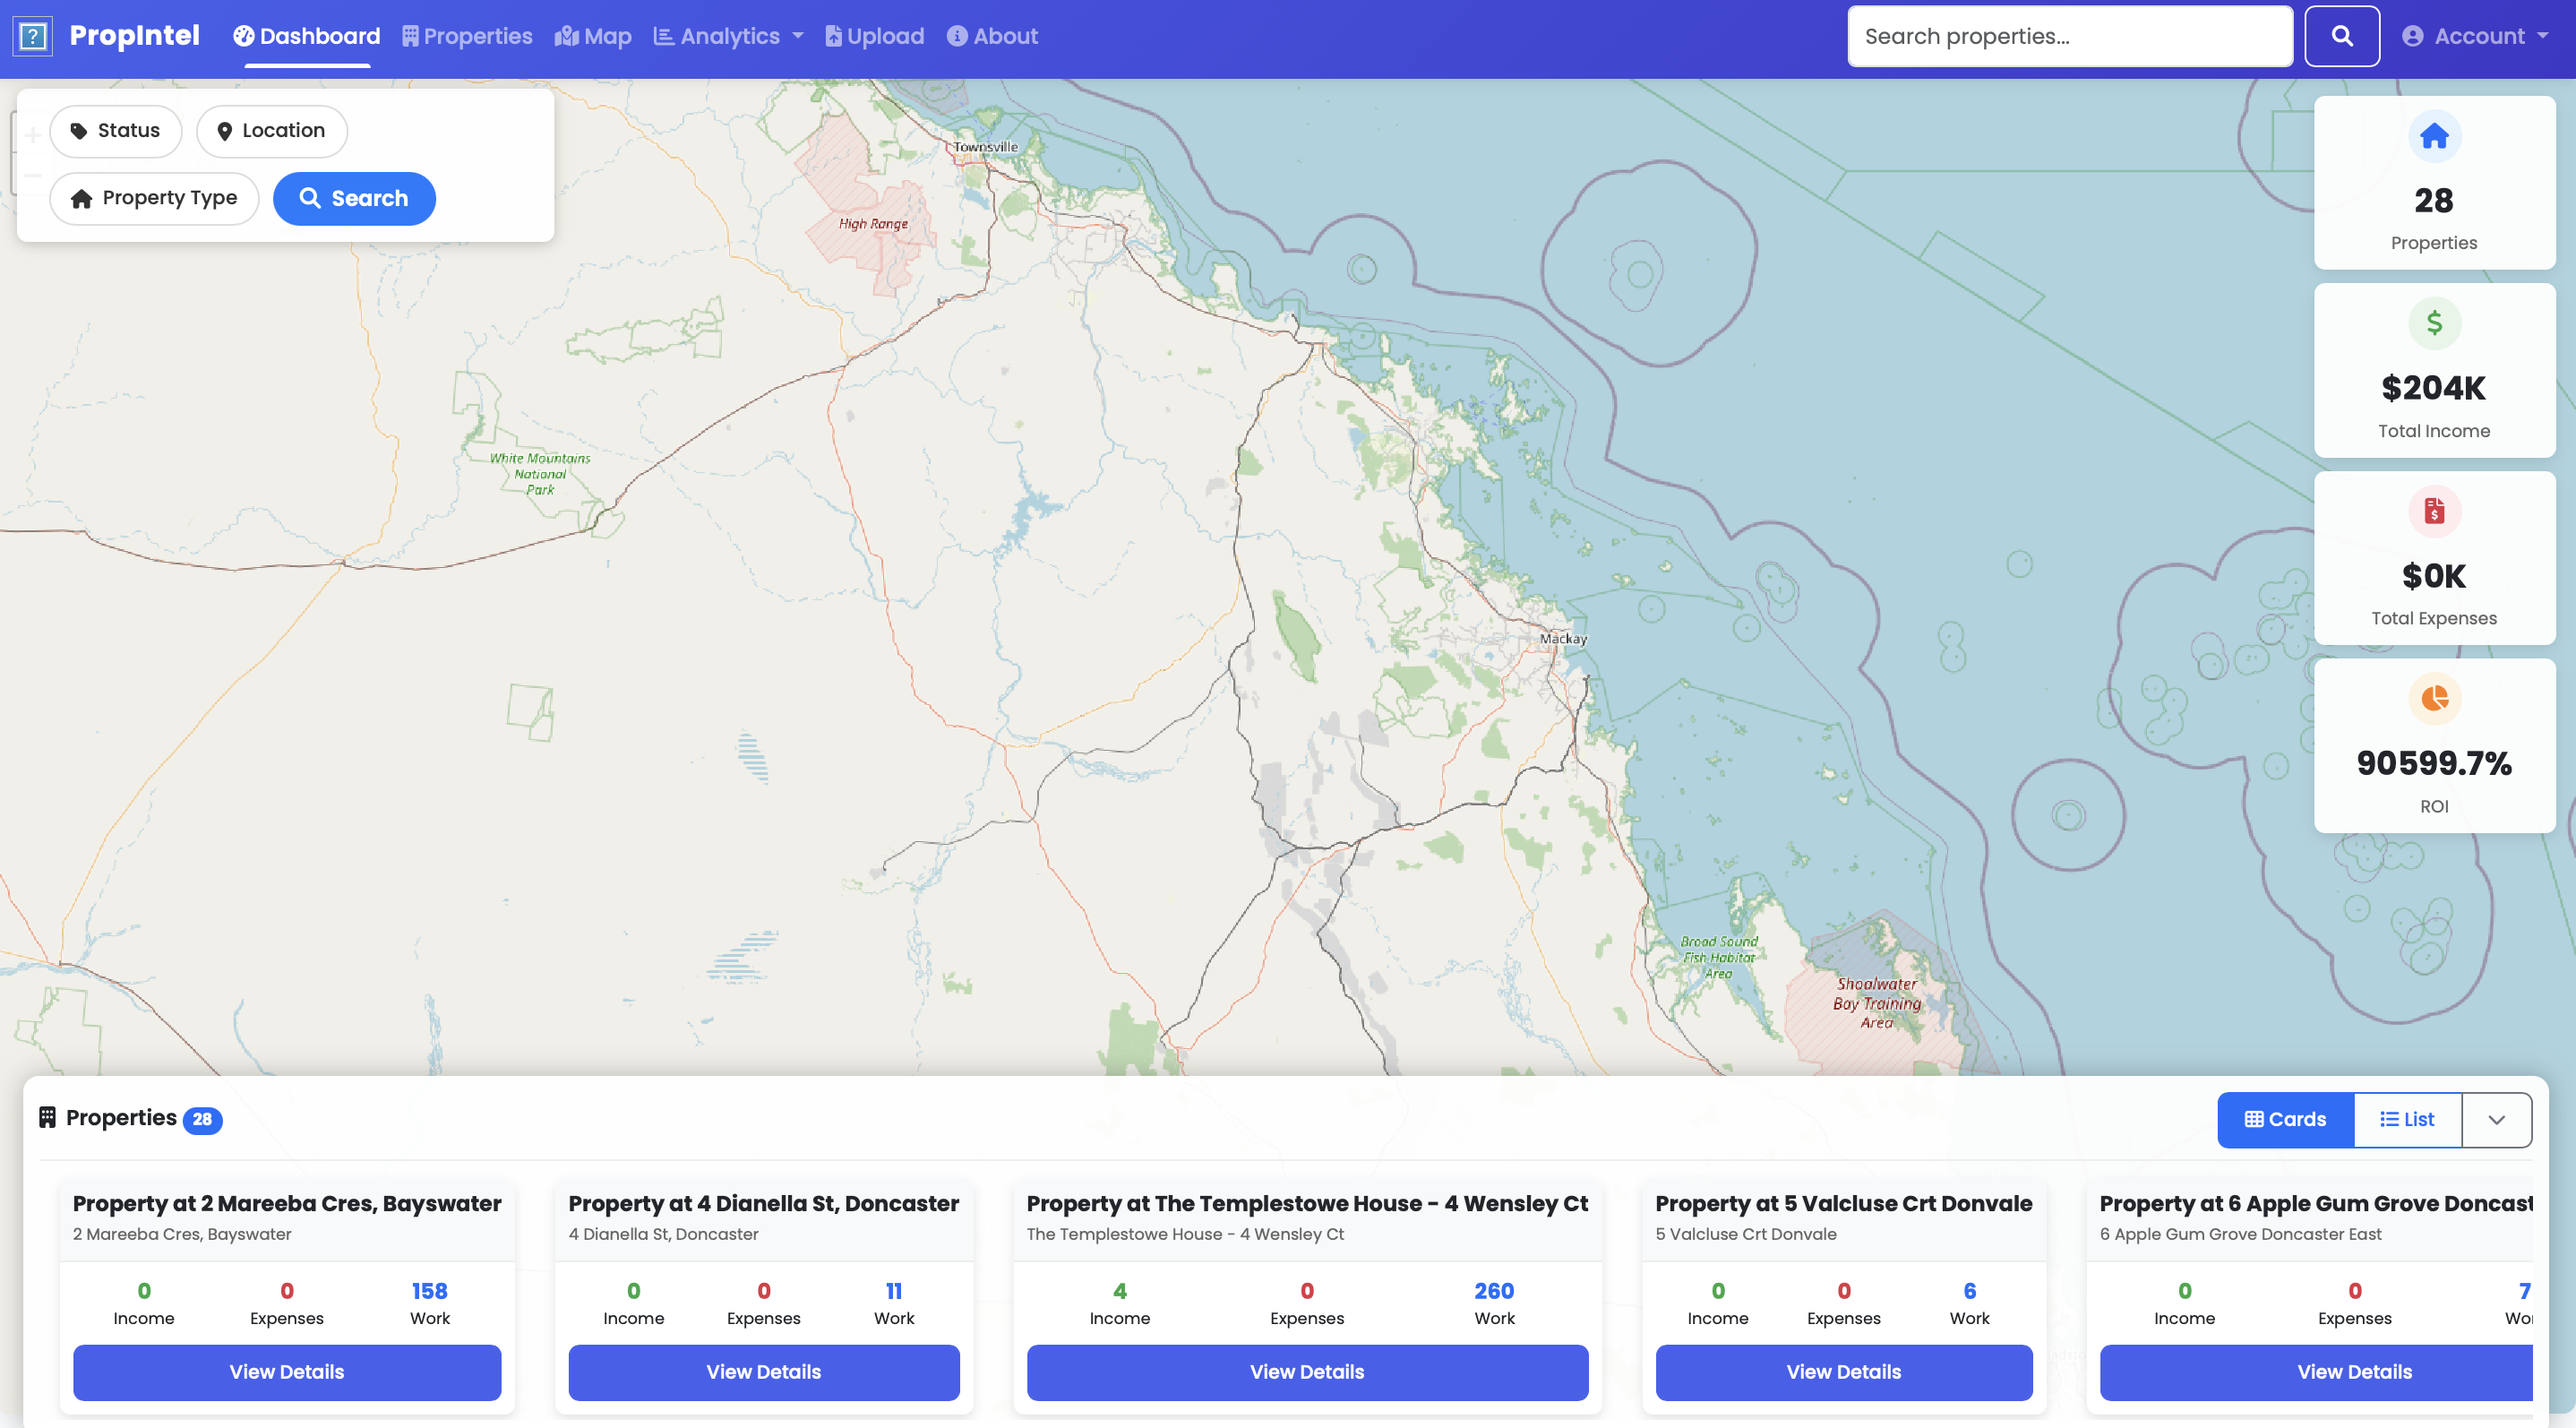
PropIntel
Overview: Property management platform automating data ingestion with interactive dashboards for real-time insights into expenses and maintenance tasks.
Methodology
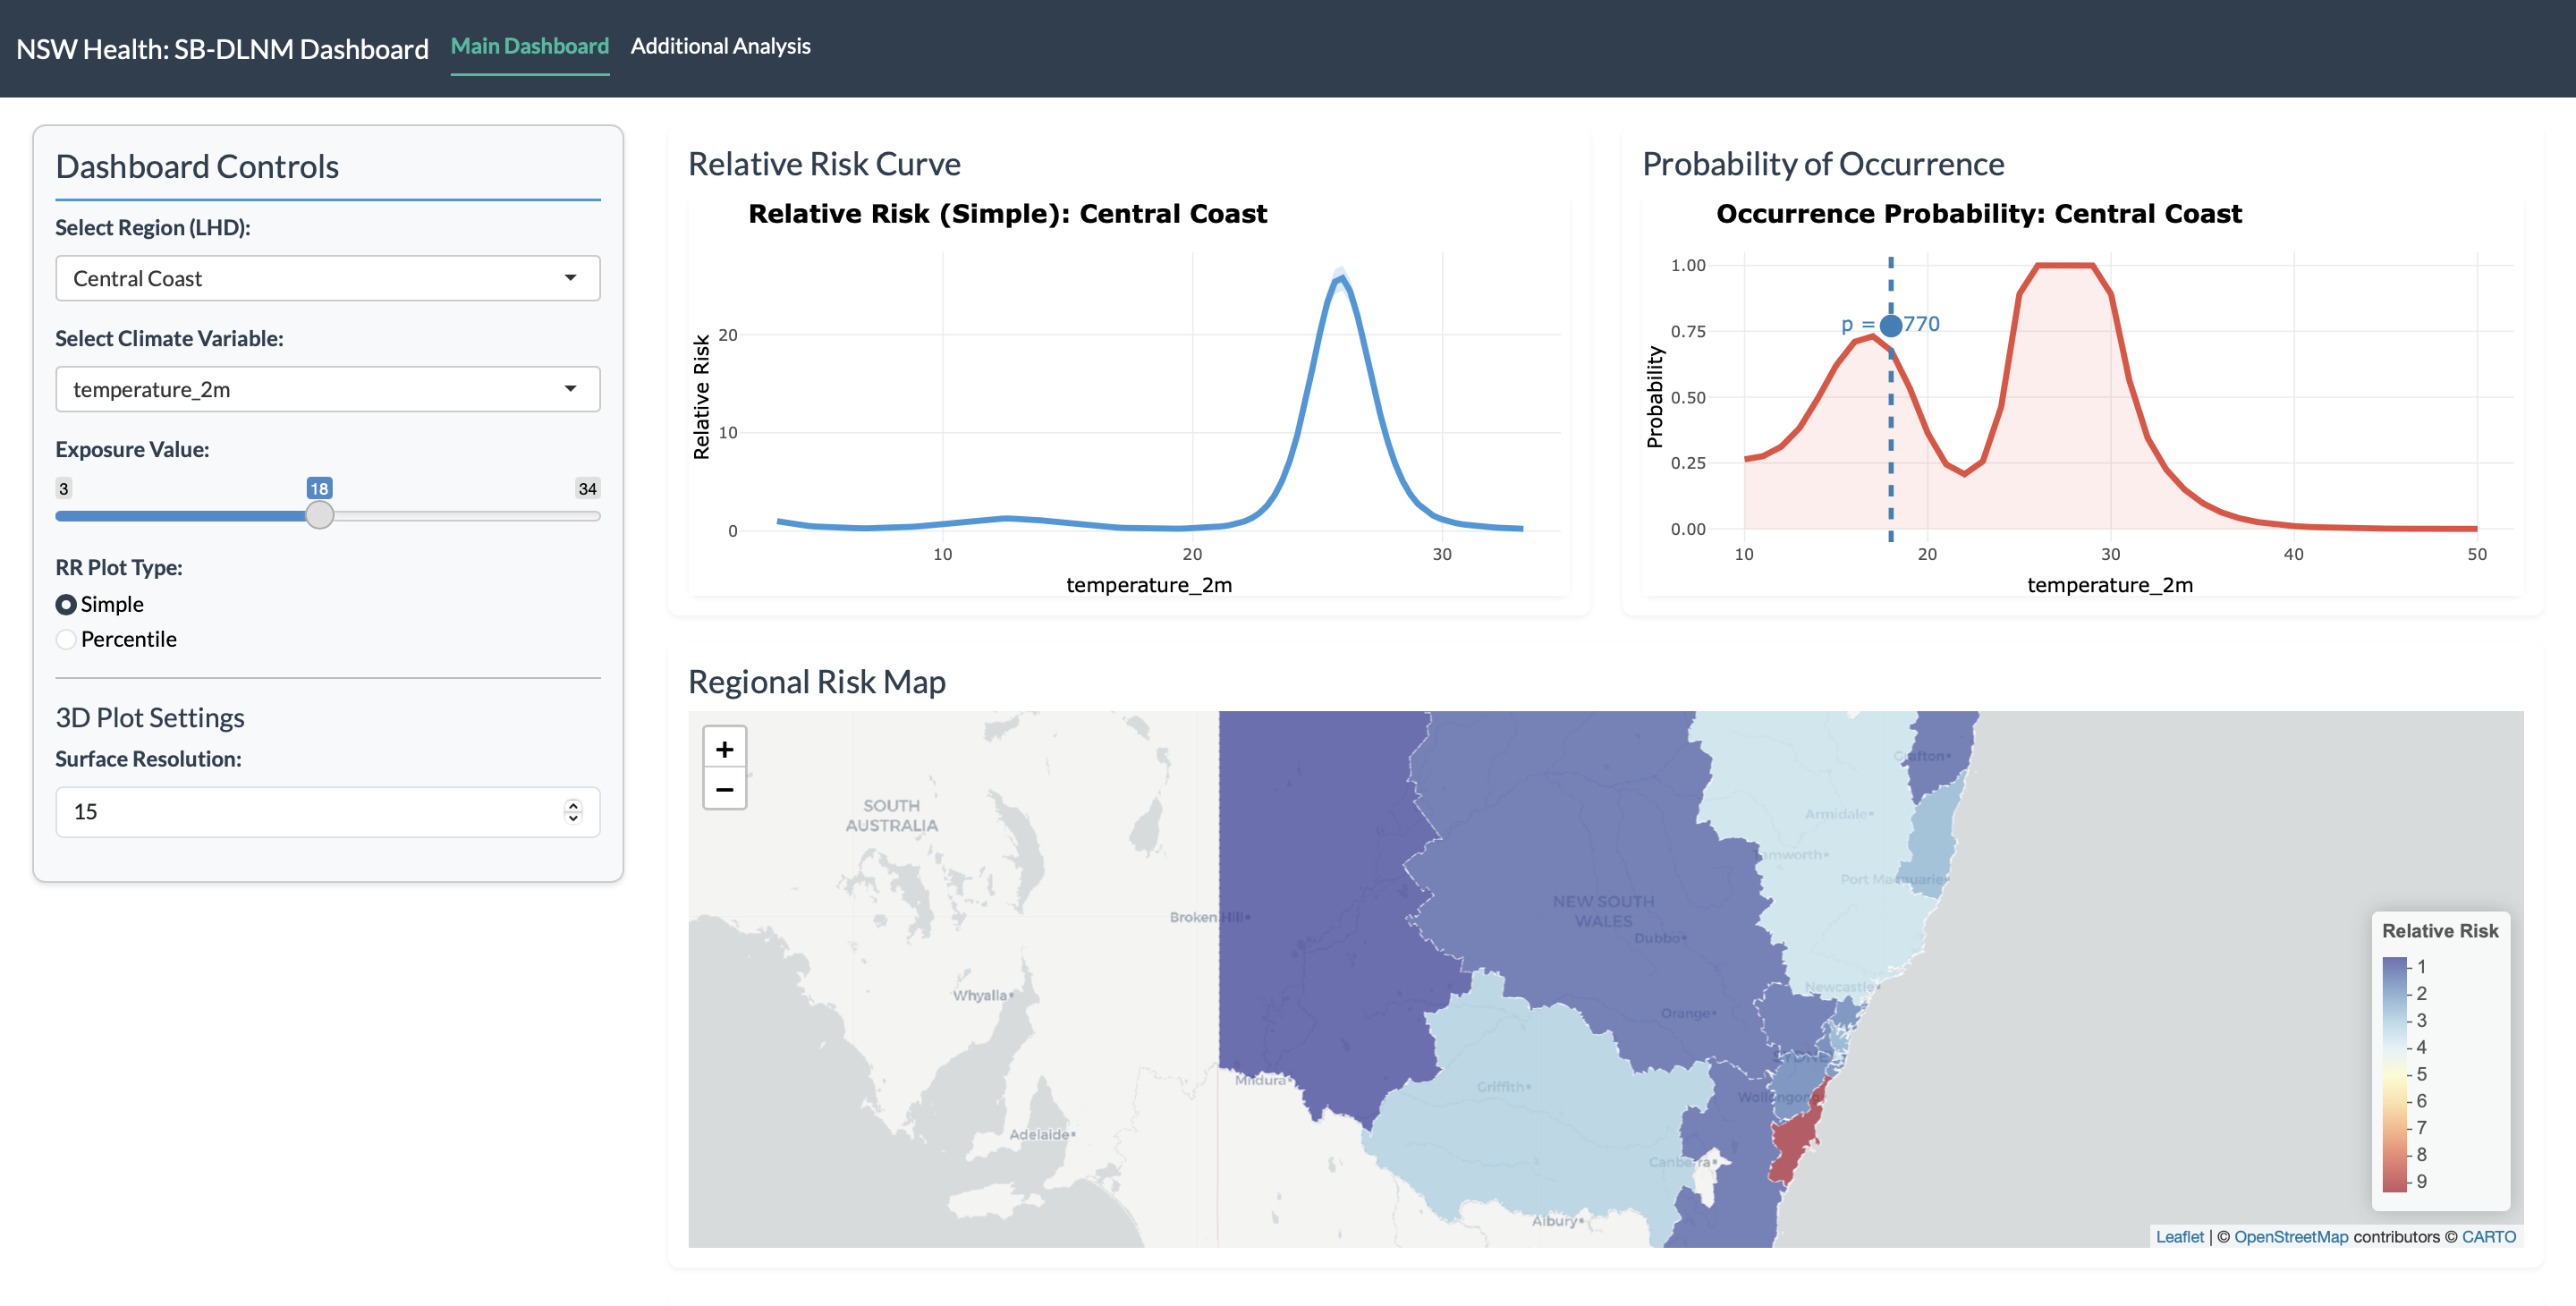
Meteorological Drivers of Influenza
Overview: Analysis of influenza cases alongside climate data using Spatial Bayesian Distributed Lag Non-Linear Models to quantify climate-influenza relationships.
Methodology
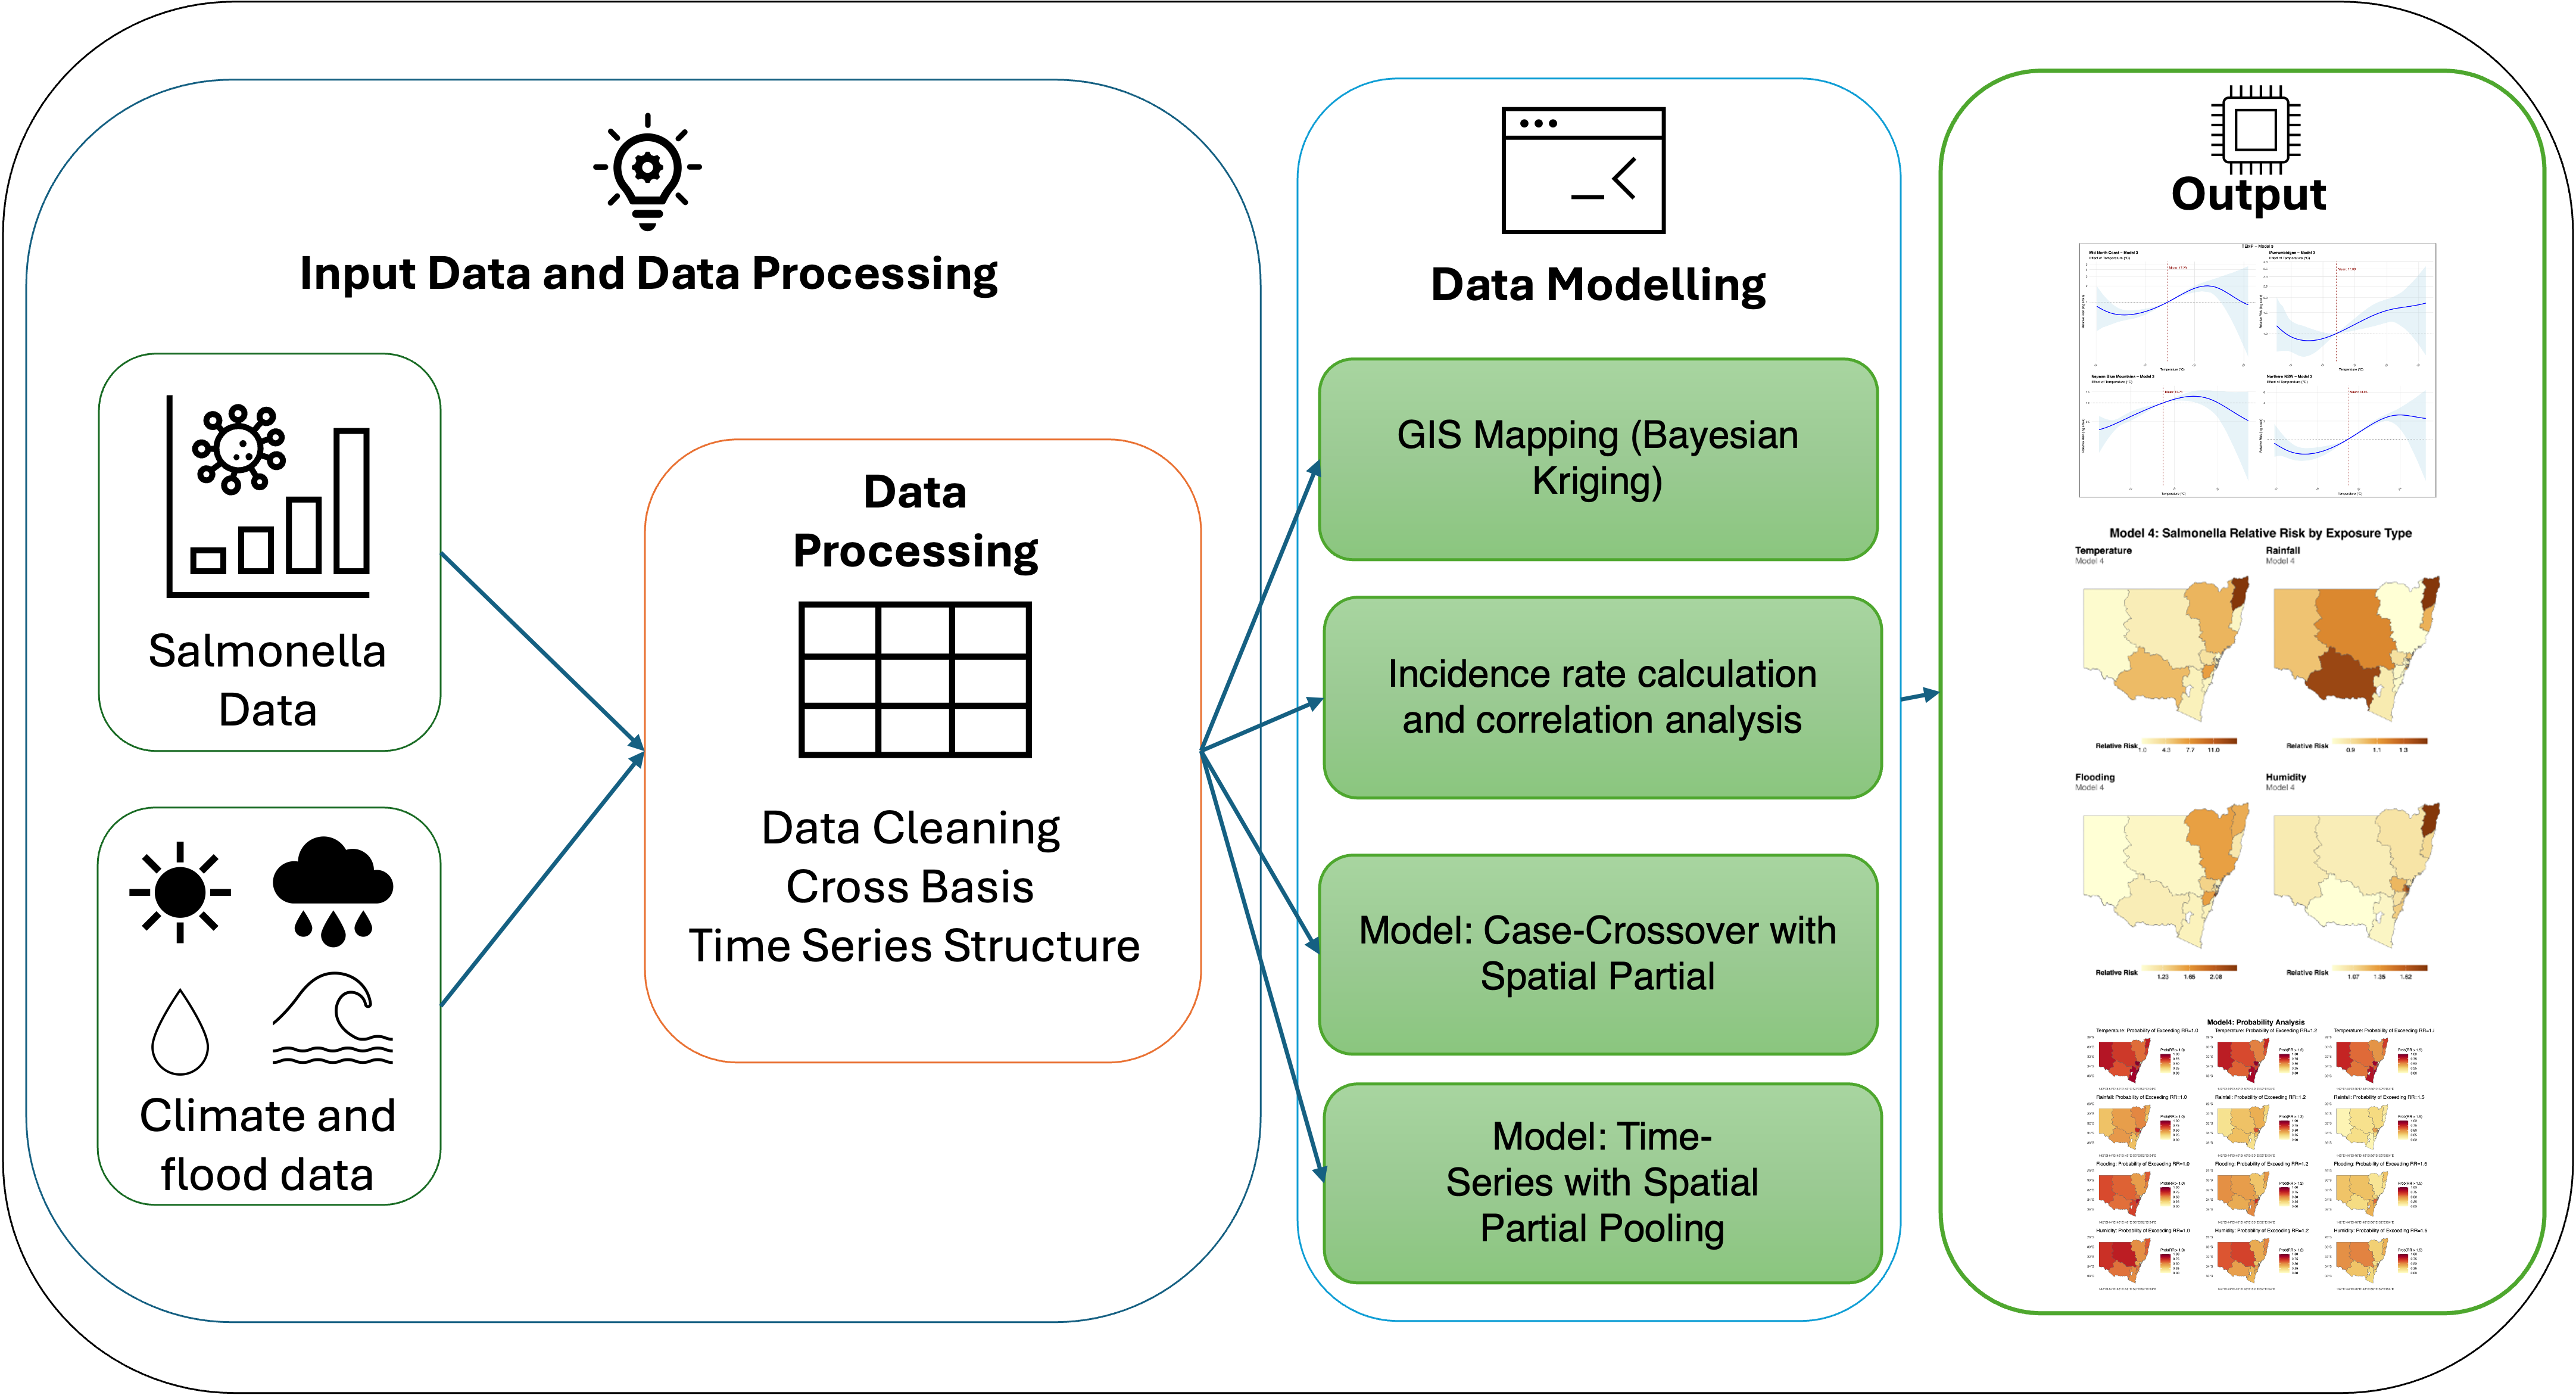
Salmonella & Climate Patterns
Overview: 32-year study investigating correlations between temperature, rainfall, floods, and Salmonella outbreaks using Bayesian spatiotemporal methods.
Methodology

Ethnic Evolution: Mapping Victoria’s Demographic Transitions
Overview: An interactive Shiny dashboard visualizing two decades of migration-driven demographic changes in Victoria, Australia. Combines choropleth maps, Sankey diagrams, clustering, and heatmaps to highlight how ethnic communities shift over time and across LGAs.